Data Science Engineering
Bioinformatics and data analysis projects that combine computational methods with biological insights to solve complex research questions and extract meaningful patterns.
Converting Grayscale to Color Using U-Net Image-to-Image Translation
Automatic colorization of grayscale images using U-Net architecture trained on STL-10 dataset (10,000 training images). Two approaches were evaluated: L1 + Perceptual Loss (VGG16) for saturated colors, and L1 Loss alone for higher accuracy. The 4-layer encoder-decoder architecture with 1,024-channel bottleneck achieves strong results on common features while maintaining appropriate uncertainty for ambiguous elements.
Project Repository
Complete U-Net implementation with training pipeline, loss functions, and evaluation metrics available on GitHub.
View on GitHubModel Architecture
- U-Net with 4 encoding/decoding layers
- L1 + Perceptual Loss (VGG16)
- Adam optimizer with data augmentation
- Trained on Google Colab T4 GPU
Protein Secondary Structure Prediction Using ESM and Random Forests
This project focused on predicting the secondary structure of proteins from their amino acid sequences. Representations were extracted using Meta AI's ESM (Evolutionary Scale Modeling), a pre-trained transformer-based protein language model. These embeddings were used as input features for a Random Forest classifier to assign secondary structure labels (e.g., helix, strand, turn) to individual amino acids. The final predictions were evaluated using Codabench, with the model achieving strong performance by combining deep learning-based representations with classical machine learning techniques.
Project Repository
Complete implementation available on GitHub with detailed documentation, code, and methodology.
View on GitHubModel Performance
Intron-Exon Classification Using DNA Language Models
This project focused on identifying intron and exon regions within genomic DNA sequences. Using labeled nucleotide sequences, the task was framed as a binary classification problem where each base was assigned a label indicating whether it belonged to an exon (1) or intron (0). The approach incorporated advanced DNA language models to extract contextual embeddings from raw sequences. Model experimentation included traditional classifiers and modern transformer-based architectures capable of processing long-range dependencies. Final predictions were evaluated on Codabench for nucleotide-level accuracy, demonstrating the effectiveness of language modeling in genomic sequence analysis.
Project Repository
Complete implementation with DNA language models, preprocessing pipelines, and evaluation metrics available on GitHub.
View on GitHubGenomic Applications
- Gene annotation and genome assembly
- Alternative splicing detection
- Variant impact prediction
- Personalized medicine and drug discovery
SNP Caller – Identifying Genetic Variants from Sequencing Data
This two-part project involved developing a single nucleotide polymorphism (SNP) caller to identify and characterize genetic variation in a specific individual based on sequencing data. In Part 1, the task was to extract sequencing reads from a BAM file that overlapped known putative SNP positions. For each SNP position, the observed bases, their corresponding quality scores (Phred scores), and the read identifiers were collected. In Part 2, the objective was to estimate the genotype probabilities (AA, AB, BB) for each SNP site using the data collected in Part 1. A probabilistic model was implemented to compute posterior genotype probabilities based on observed base calls and their associated quality scores, using log probabilities and the log-sum-exp trick to ensure numerical stability during inference.
Project Repository
Complete SNP calling pipeline with BAM file processing, quality score analysis, and genotype probability estimation available on GitHub.
View on GitHubTechnical Implementation
- BAM file parsing and read extraction
- Phred quality score analysis
- Probabilistic genotype inference
- Log-sum-exp numerical stability
Transcript Abundance Estimation with the EM Algorithm
This project used the Expectation-Maximization (EM) algorithm to estimate the relative abundances of RNA isoforms from RNA-seq data. Following the RSEM framework, sequencing reads were mapped to two isoforms with differing effective lengths, and isoform proportions were iteratively updated based on read compatibility. The project included both a manual derivation and a Python implementation of the EM procedure. Experiments showed that isoform length significantly impacts abundance estimates, with longer isoforms receiving lower weight due to reduced sequencing probability. When lengths were equal, estimates were unbiased and evenly distributed.
Manual Length Bias Analysis
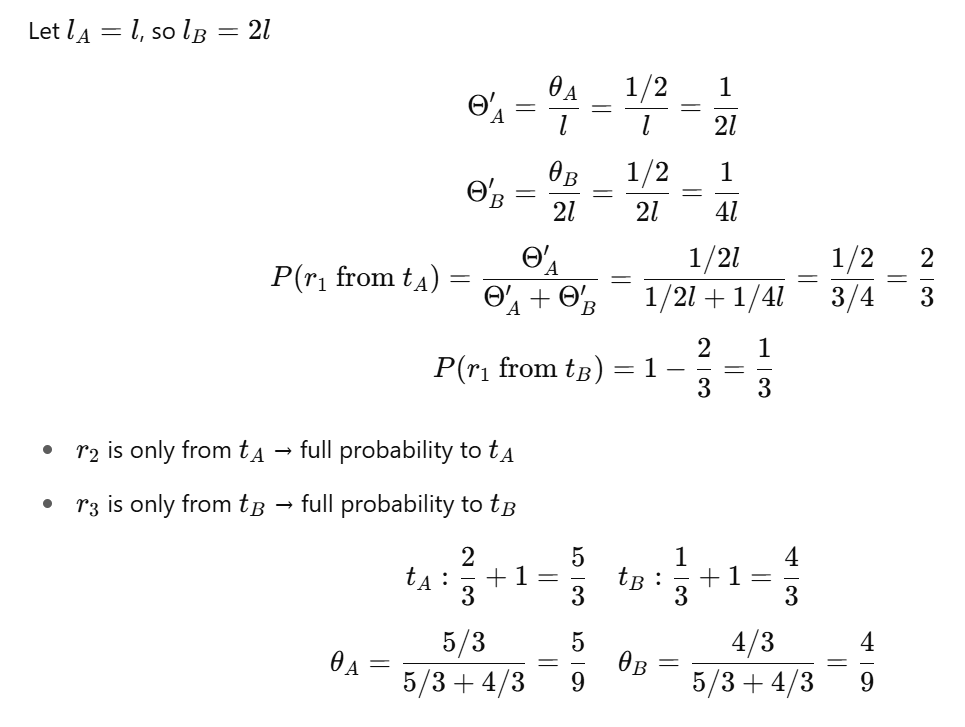
Equal Length Analysis
When both isoforms have equal length (10), no bias exists:
• r₁'s contribution splits evenly between transcripts
• Effects cancel out → θA = θB = 0.5
When tB is twice as long, it has lower effective sequencing probability per base, giving more weight to tA
Project Repository
Complete EM algorithm implementation with RSEM framework adaptation and RNA-seq abundance estimation available on GitHub.
View on GitHubVisualizing High-Dimensional Data with t-SNE
This project implements the t-SNE (t-Distributed Stochastic Neighbor Embedding) algorithm from scratch to visualize high-dimensional data in 2D space. The implementation includes the complete mathematical framework for computing pairwise similarities in high-dimensional space using Gaussian distributions, followed by optimization in low-dimensional space using t-distributions. The project explores how different variance parameters (σ²) affect neighborhood preservation and demonstrates the algorithm's effectiveness on various datasets including synthetic clusters and real-world high-dimensional data.
Project Repository
Complete t-SNE implementation from scratch with mathematical derivations, parameter exploration, and visualization examples. Includes detailed analysis of how variance parameters affect similarity calculations and neighborhood preservation in dimensionality reduction.
View on GitHubGraphs and Figures
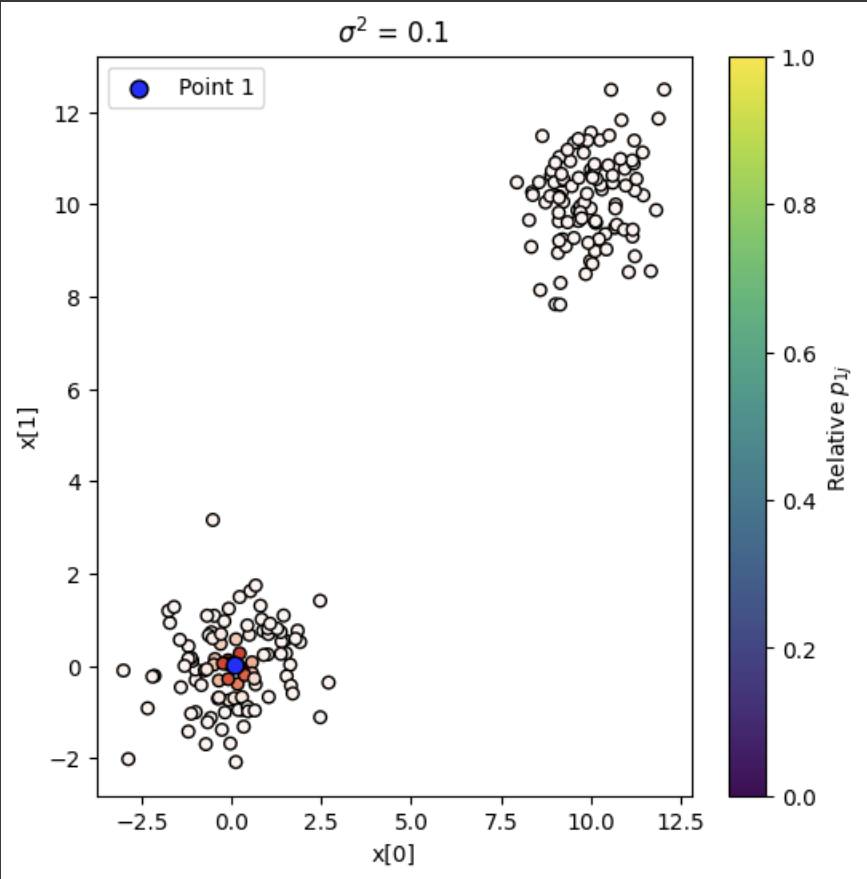
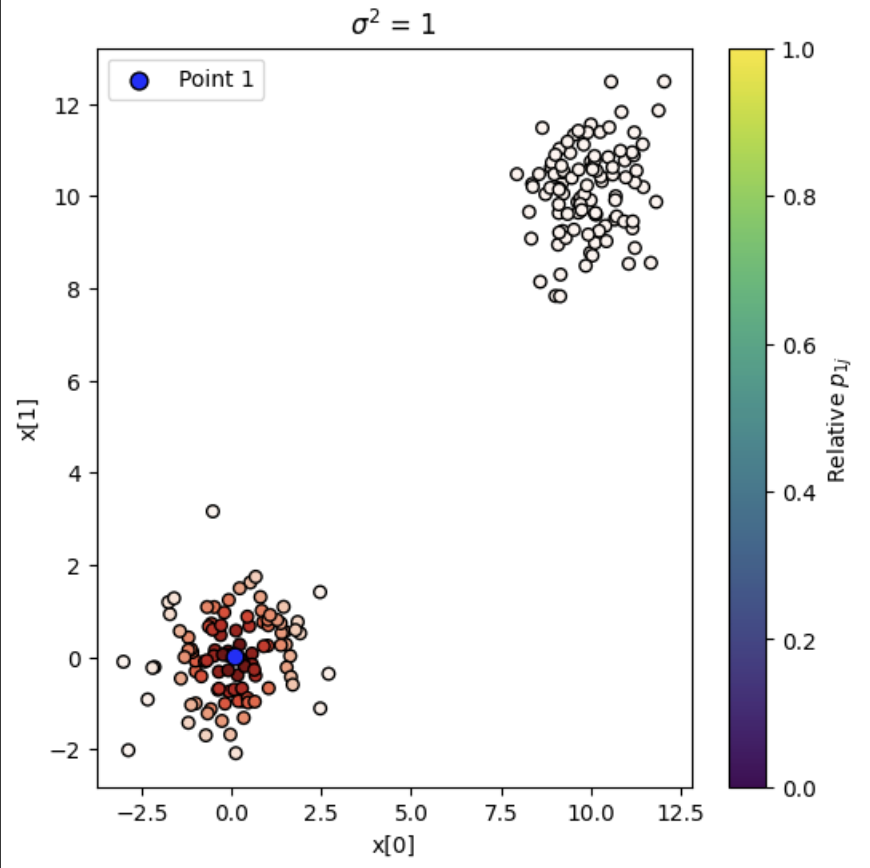
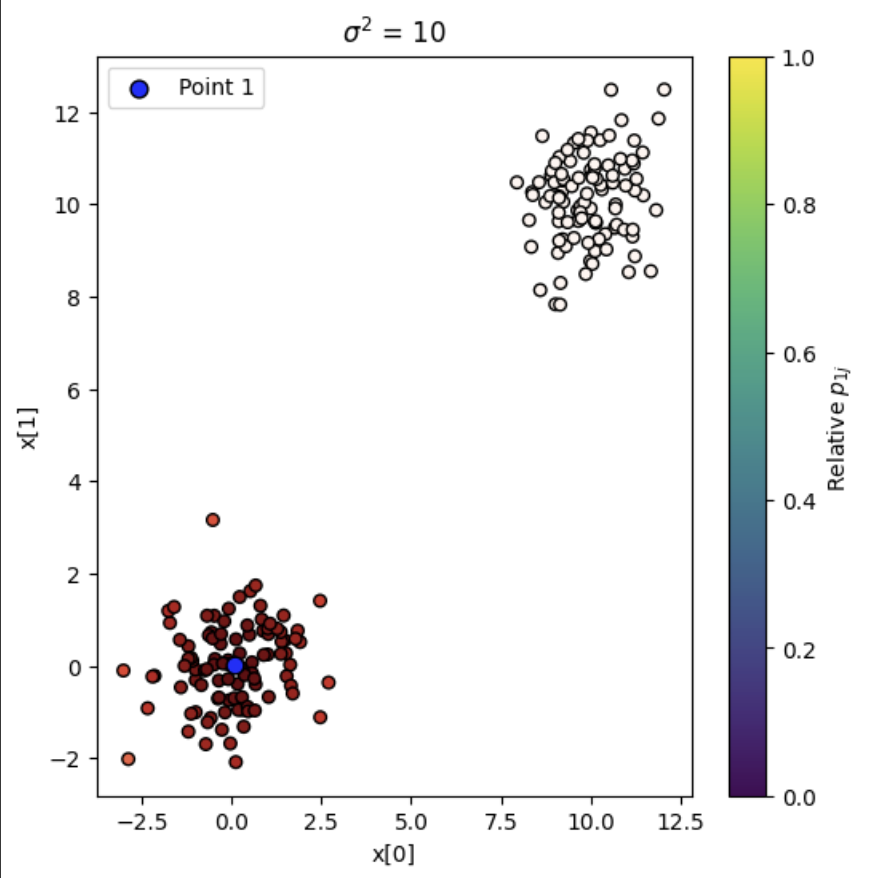
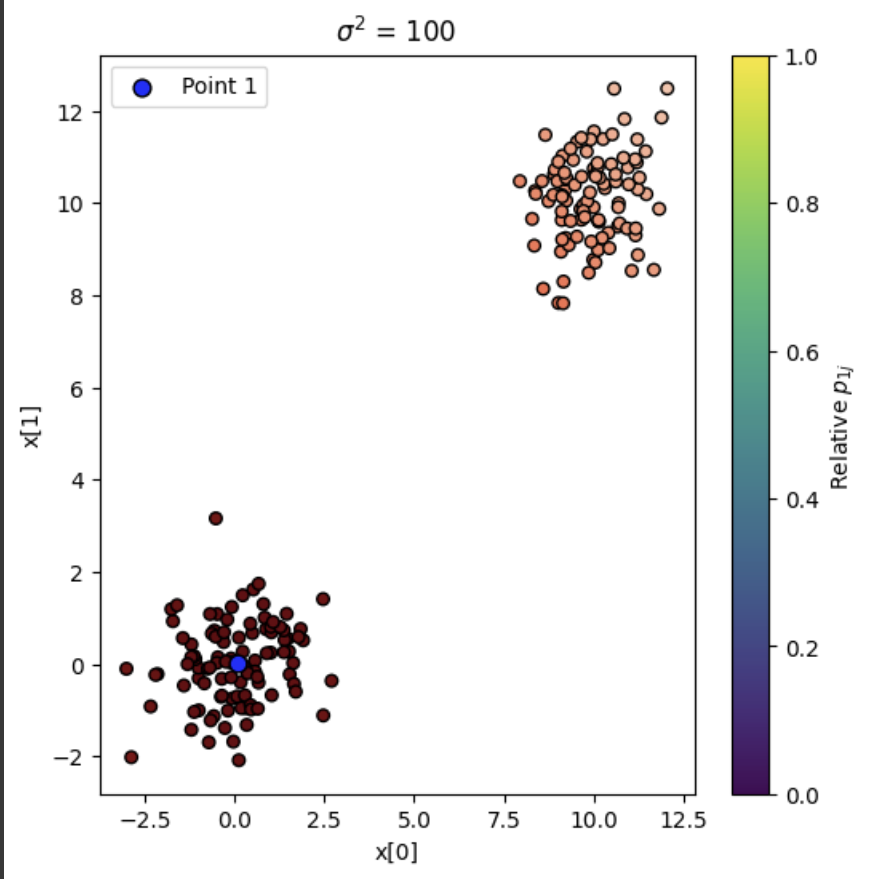
The plots show how the similarity probabilities (p₁ⱼ) from the first point to all others change depending on the value of σ². When σ² is small (e.g., 0.1), the similarity drops off quickly, so only very close neighbors are highlighted. When σ² is large (e.g., 100), the similarity spreads broadly and all points look more similar. The best balance occurs when σ² = 1, where the neighborhood is captured meaningfully without over-smoothing or being too narrow. The color intensity in each graph reflects how strongly each point is considered a neighbor of the first point.
Low-Dimensional q₁ⱼ Probabilities
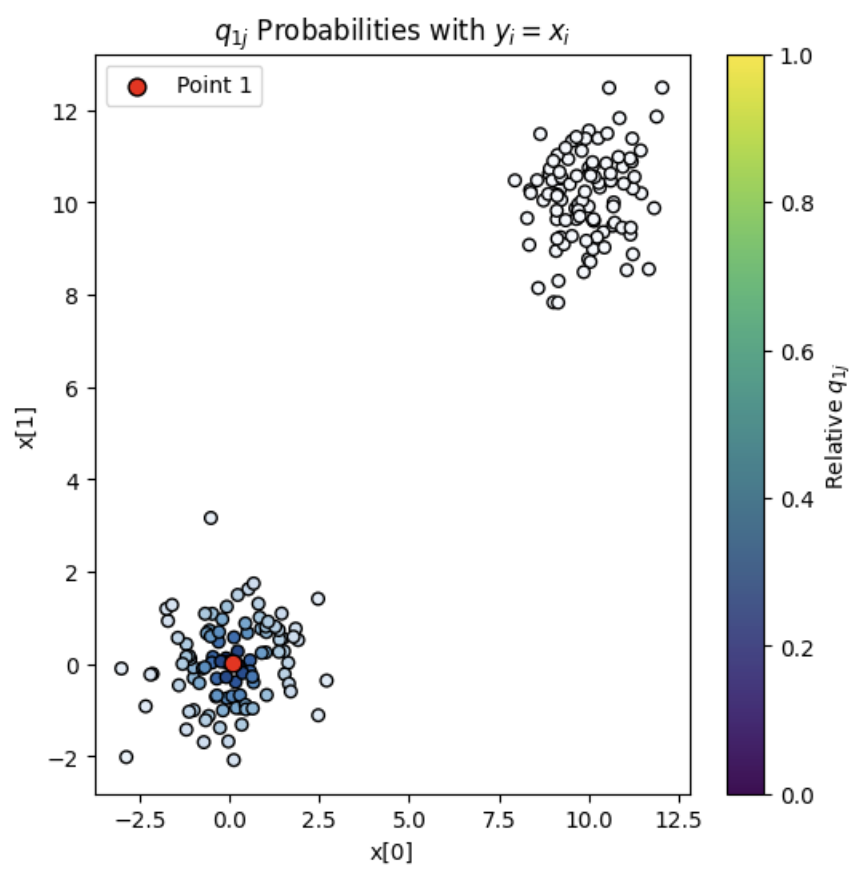
This graph uses the low-dimensional representation set equal to the original data (yᵢ = xᵢ) to visualize the q₁ⱼ probabilities, which measure how likely each point is to be a neighbor of the first point in the low-dimensional space. Unlike the earlier p₁ⱼ plots, which are sensitive to σ², this plot reflects the heavy-tailed Student-t distribution used in t-SNE. As a result, the influence of distant points decays more slowly, producing a more spread-out similarity pattern compared to the sharper focus seen with p₁ⱼ when σ² = 1.
KL-Divergence Validation
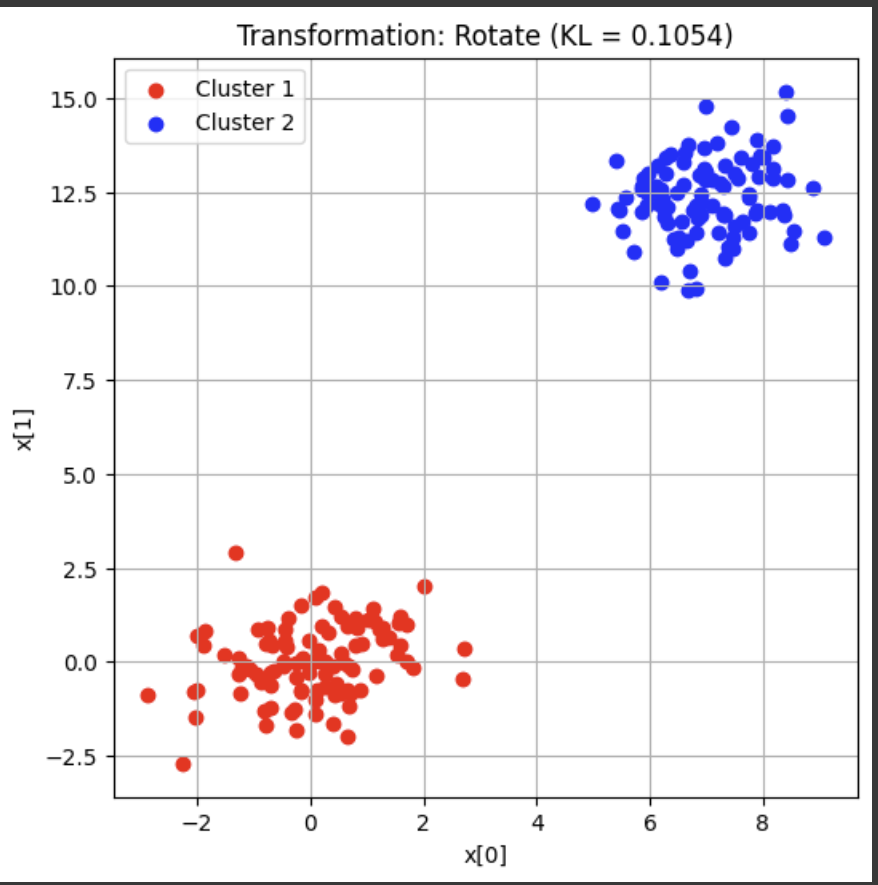
This graph compares the high-dimensional similarity matrix (p₁ⱼ) with the low-dimensional similarity matrix (q₁ⱼ), using the KL-divergence as a measure of how well the low-dimensional space preserves neighborhood relationships. The graph shows that the divergence decreases over iterations of optimization, indicating that the low-dimensional embedding is improving its match to the original data structure. The lower the KL-divergence, the better the alignment between how points relate in the high-dimensional space versus their projection. This helps validate the effectiveness of the t-SNE mapping process.
Perplexity and Sigma-Squared Analysis
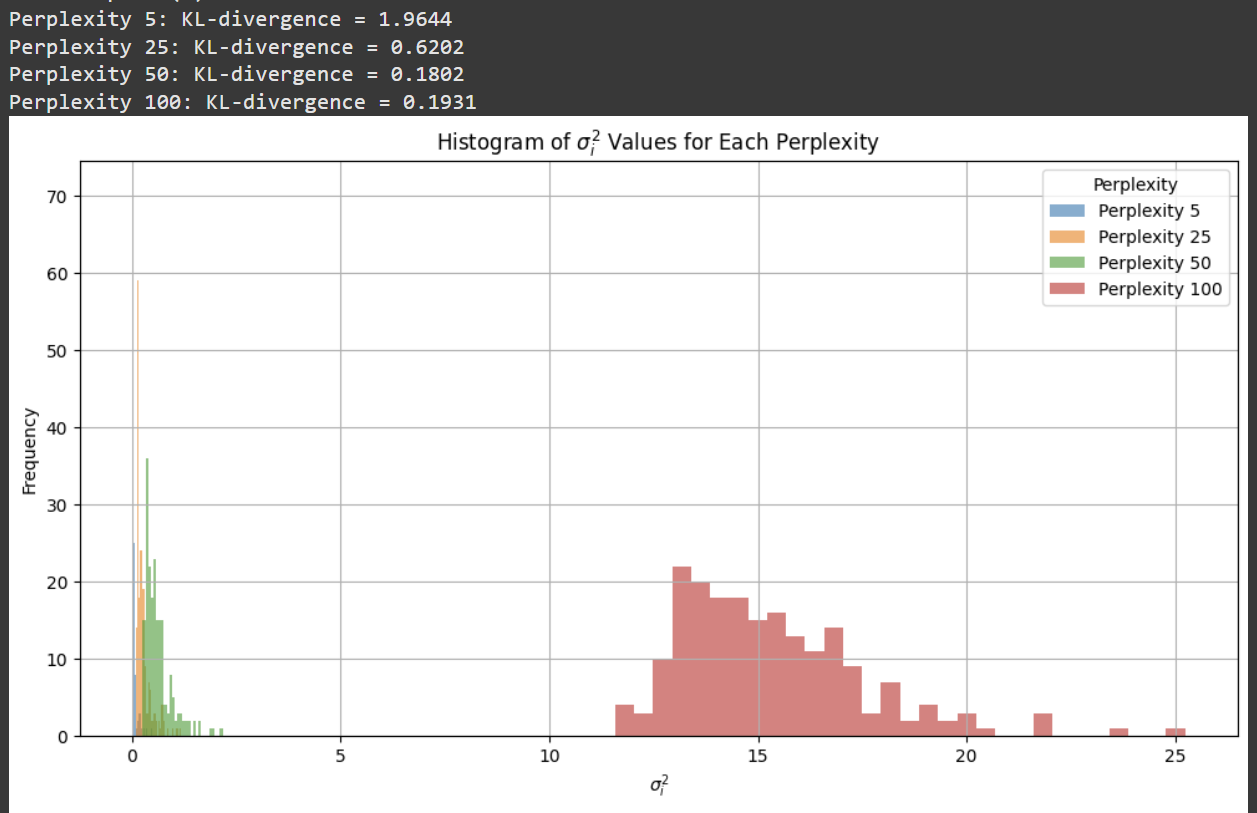
The graph in part (j) shows how different values of the variance parameter (sigma squared) affect the KL-divergence between the high-dimensional and low-dimensional similarity distributions. As sigma squared increases, the KL-divergence decreases, suggesting that the low-dimensional space better captures the structure of the high-dimensional data. However, extremely large values may lead to over-smoothing, while very small values may overemphasize local structure. This graph illustrates the importance of tuning sigma squared to achieve a good balance between preserving local neighborhoods and maintaining global relationships in the projection.
Bioinformatics Impact & Applications
These computational biology projects demonstrate the power of combining machine learning with genomic data analysis. From protein structure prediction to genetic variant calling, each project contributes to advancing precision medicine and our understanding of biological systems.
Protein Analysis
- Drug target identification
- Structural biology insights
- Therapeutic design
Genomic Medicine
- Personalized treatment plans
- Disease risk assessment
- Population genetics studies
Computational Methods
- Language model applications
- Probabilistic inference
- High-throughput analysis